Pre-race analysis
Low and even tyre wear rewards track position
Before the Austrian Grand Prix at the Red Bull Ring on Sunday 28 June 2026, we studied the timing and telemetry and wrote down our predictions: how each dry tyre will wear, and what we predict that will do to the race. Pirelli has nominated the same three compounds raced here in 2025, and we measured that race lap by lap, so this is our most directly grounded analysis yet. Here are the predictions and the chart behind them.
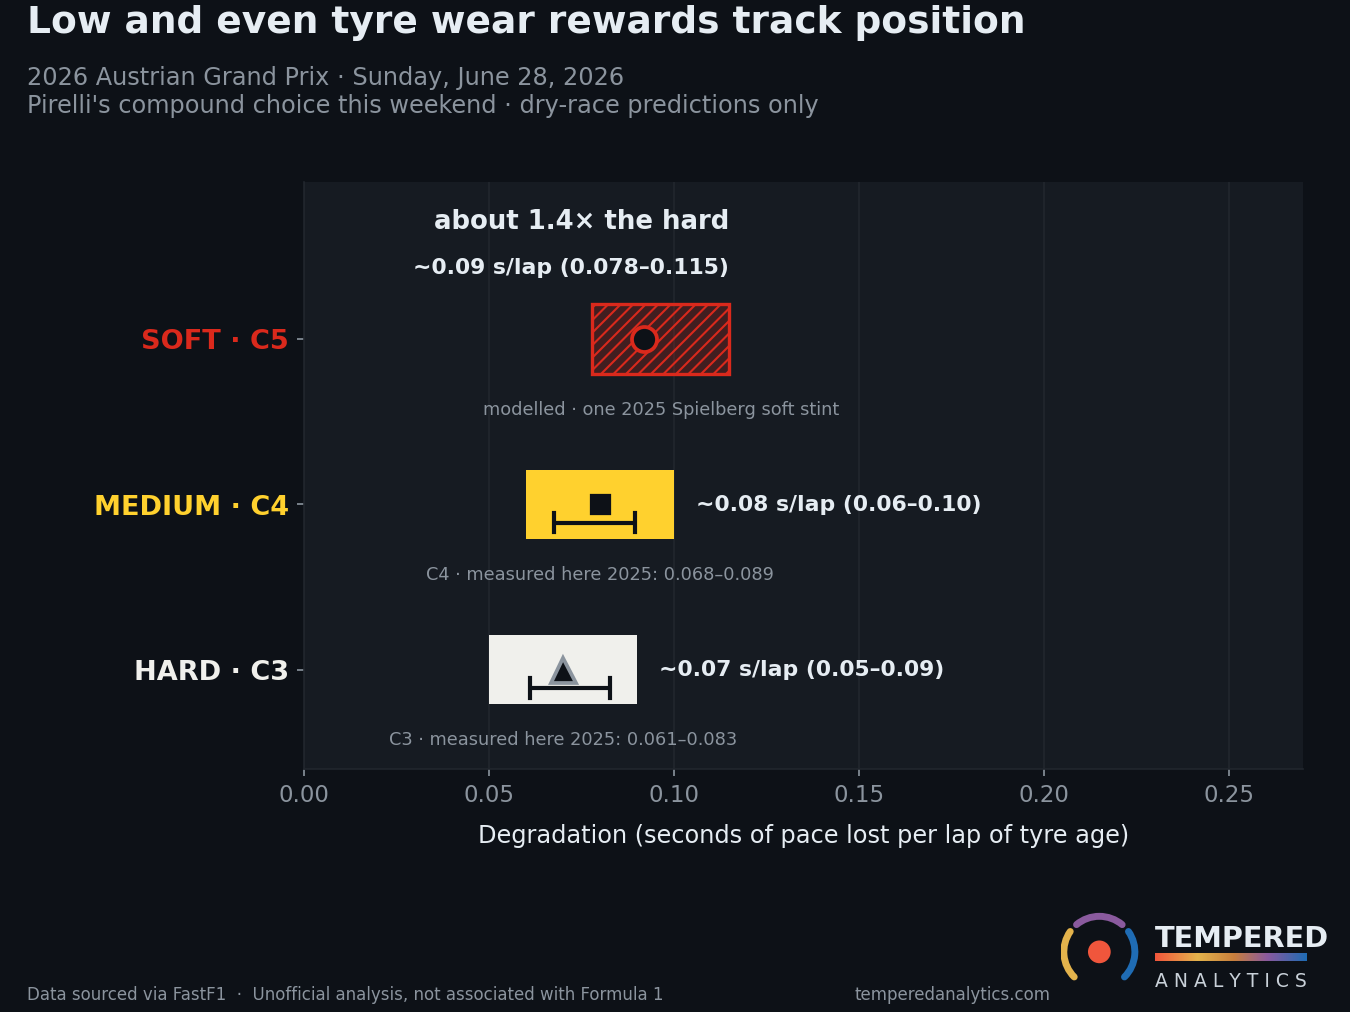
The shape of the prediction is unusual. The hard and the medium wear at almost the same low rate, around 0.07 seconds a lap, and their predicted bands overlap. Last year the medium degraded at only about 1.1 times the hard, less than a hundredth of a second a lap. That is nowhere near Barcelona, where the medium wore about 1.5 times the hard. The soft wears faster, about 1.4 times the hard, though we modelled that from a single long soft stint last year. Even so it is far from the three-times gap at Barcelona, and on a low-wear track like this it does not separate the cars the way it did in Spain. When every tyre lasts, no one gains much from the timing of a pit stop. The undercut, pitting first to put new rubber on while a rival stays out, did not pay here last year: across the clean stops we measured, the car that pitted first typically lost about half a second rather than gaining. Two stops was still the common plan, but with wear this flat the race is decided by where you start and whether you hold position through the stops, not by the tyre choice. Track position decides this race, so qualifying and the run to the first corner matter more here than they did at Barcelona.
The predictions, before the race
Written down before lights out:
- The medium degrades less than 1.5 times the hard, on race stints. The compounds wear at nearly the same rate here, the opposite of Barcelona, where the gap was the story.
- The hard degrades between 0.05 and 0.09 seconds a lap. Low and steady: the same compound, measured from last year's race here, with the band widened for the new 2026 construction. We set the top of the band above last year's hottest stint on purpose, so the prediction already allows for a hotter race.
- A green-flag pit stop costs 20–23 seconds. Last year the median was about 21 seconds.
- The undercut barely works: a clean first-stop undercut gains less than a second. Last year the clean stops we measured typically lost about half a second, not gained.
- The soft degrades about 0.09 seconds a lap, roughly 1.4 times the hard. This is our model's prediction, anchored to a single 2025 stint here, so we widened it to account for that thin basis. It is also the tyre most exposed if the race runs hot.
Conditions, stated before the race. The FIA has declared a heat hazard for Sunday's race: the official forecast expects a heat index above 31°C, which requires extra car cooling and a small minimum-weight increase. Heat tends to push tyre wear up, most on the soft and least on the hard, and it pushes hardest at the top of each band. We are watching those top edges closely on Sunday: the soft carries the most heat risk on the thinnest data, and the hard is next, and its band was already widened to allow for a hotter race. We have flagged the heat but left our band numbers unchanged, because the forecast gives a direction, not an amount we can measure. So if the wear lands at the top of a band, on the soft or the hard, that is the hot-race context we flagged. The centre of a band is still a fully valid result.
If the race is wet, the wear predictions do not stand. Heat is different: we set these bands for a hot race and flagged the heat before lights out, so if a tyre wears past the top of its band on Sunday, that is a real miss we own, not something the heat excuses. If fewer than two cars run a long clean soft stint on Sunday, we will show the soft prediction but not score it. After the race we check every prediction against what the race measured, right or wrong. If we are wrong, you will see it in our own charts.
The basis for these predictions
- Straight from the source. Every number comes from the sport's public timing and telemetry, never broadcast footage or official graphics.
- Measured here last year. Pirelli has nominated the same three compounds it ran here in 2025, so we start from a direct measurement of these exact tyres racing on this exact track a year ago, not a guess carried over from somewhere else.
- A direction, not a promise. The 2026 tyres are a new, narrower construction, so we treated last year's measurement as a direction and widened the band rather than copying the number across. The medium had a wide spread between drivers last year too, so its band is genuinely uncertain, and the soft rests on a single long stint, so we modelled it, widened it further, and marked it on the chart as modelled.
- Clean laps only. The wear numbers use the laps that show the tyre's true pace, with safety-car laps, traffic, and pit-lane laps set aside.